This week we have seen the latest update to ArcGIS Online. You may have read the blog I wrote earlier in the month highlighting some of the updated design features. These include improved filtering and searching, as well as the reorganisation of pages to ensure the content you need to access is in one easy to find location. The new design is pretty exciting, but I have been exploring the other updates as well. Read on to find out more.
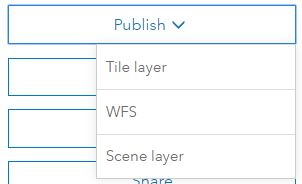
Publishing Scene Layers
The first new capability I found is the ability to publish hosted Scene Layers from Feature layers in ArcGIS Online. In a previous update the ability to publish hosted tile layers and WFS services were added, but now, with the steady increase of 3D Scene users, we have the ability to publish Scenes Layers too. This only applies to point and multipatch layers.
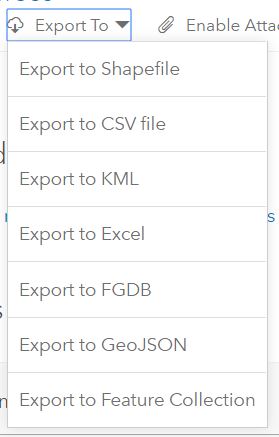
Exporting as KML & Excel files
You will also notice in the latest update that you now have the capability to export Hosted Feature Layers as KML and Excel files. You may also be interested to hear that you can now publish Hosted Feature Layers from Excel, rather than just from CSVs as previously done.
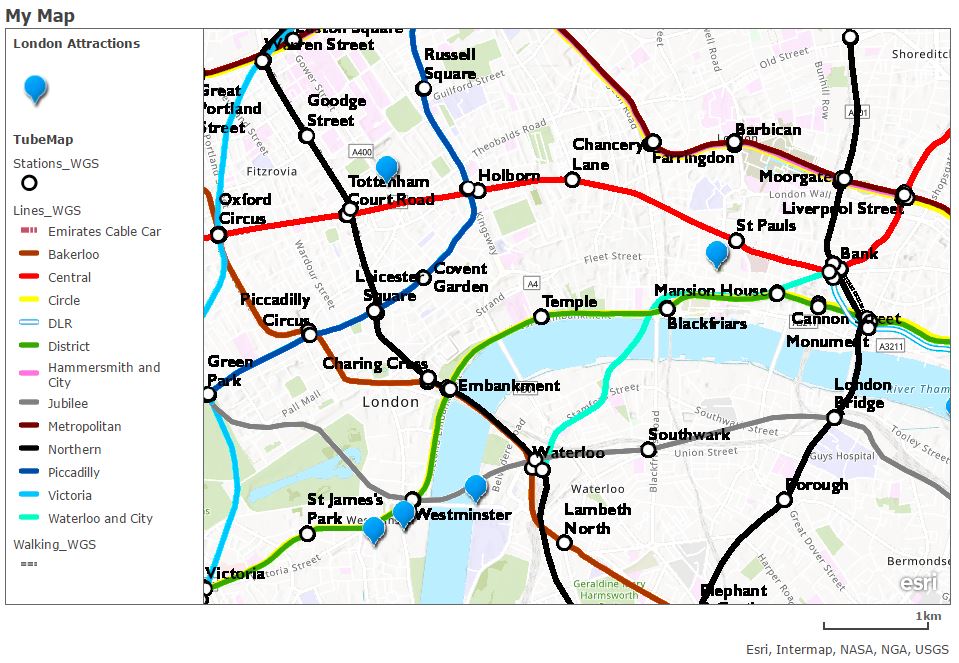
Legends added when printing!
With all the excitement over Web and Mobile GIS, printing paper and PDF maps have not been at the forefront of development. However, due to your feedback, printing from the map viewer has been improved – with the ability to print maps with a legend. Below is an example of how a print out may look.
Arcade expressions now available in pop-ups
Arcade label expressions were introduced at the end of 2016 . They allowing you to configure the way your label texts are displayed and the same expression can be used in a web map and in ArcGIS Pro. You can now also use Arcade to enhance pop-ups by dynamically creating new information from existing fields. For example, you may want to display the crime rate within an area, but you only have fields with crime type, number of crimes, and population. Using Arcade you can dynamically create a field which shows the rate using the three fields already populated.
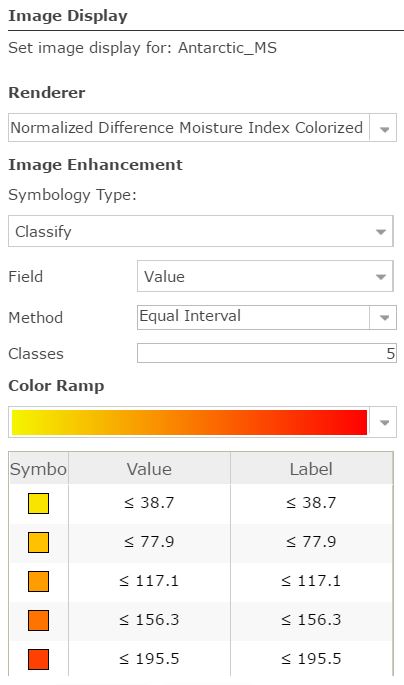
Smart Mapping for Imagery
You can now visualise imagery layers using Symbology Type, which brings smart mapping into imagery display – as shown in the image on the right.
Create a Dashboard with Web AppBuilder
A new Dashboard theme in Web AppBuilder has been released in the update. It enables multiple widgets to be opened and displayed when the application loads. You can choose the design, layout and the number of widgets.
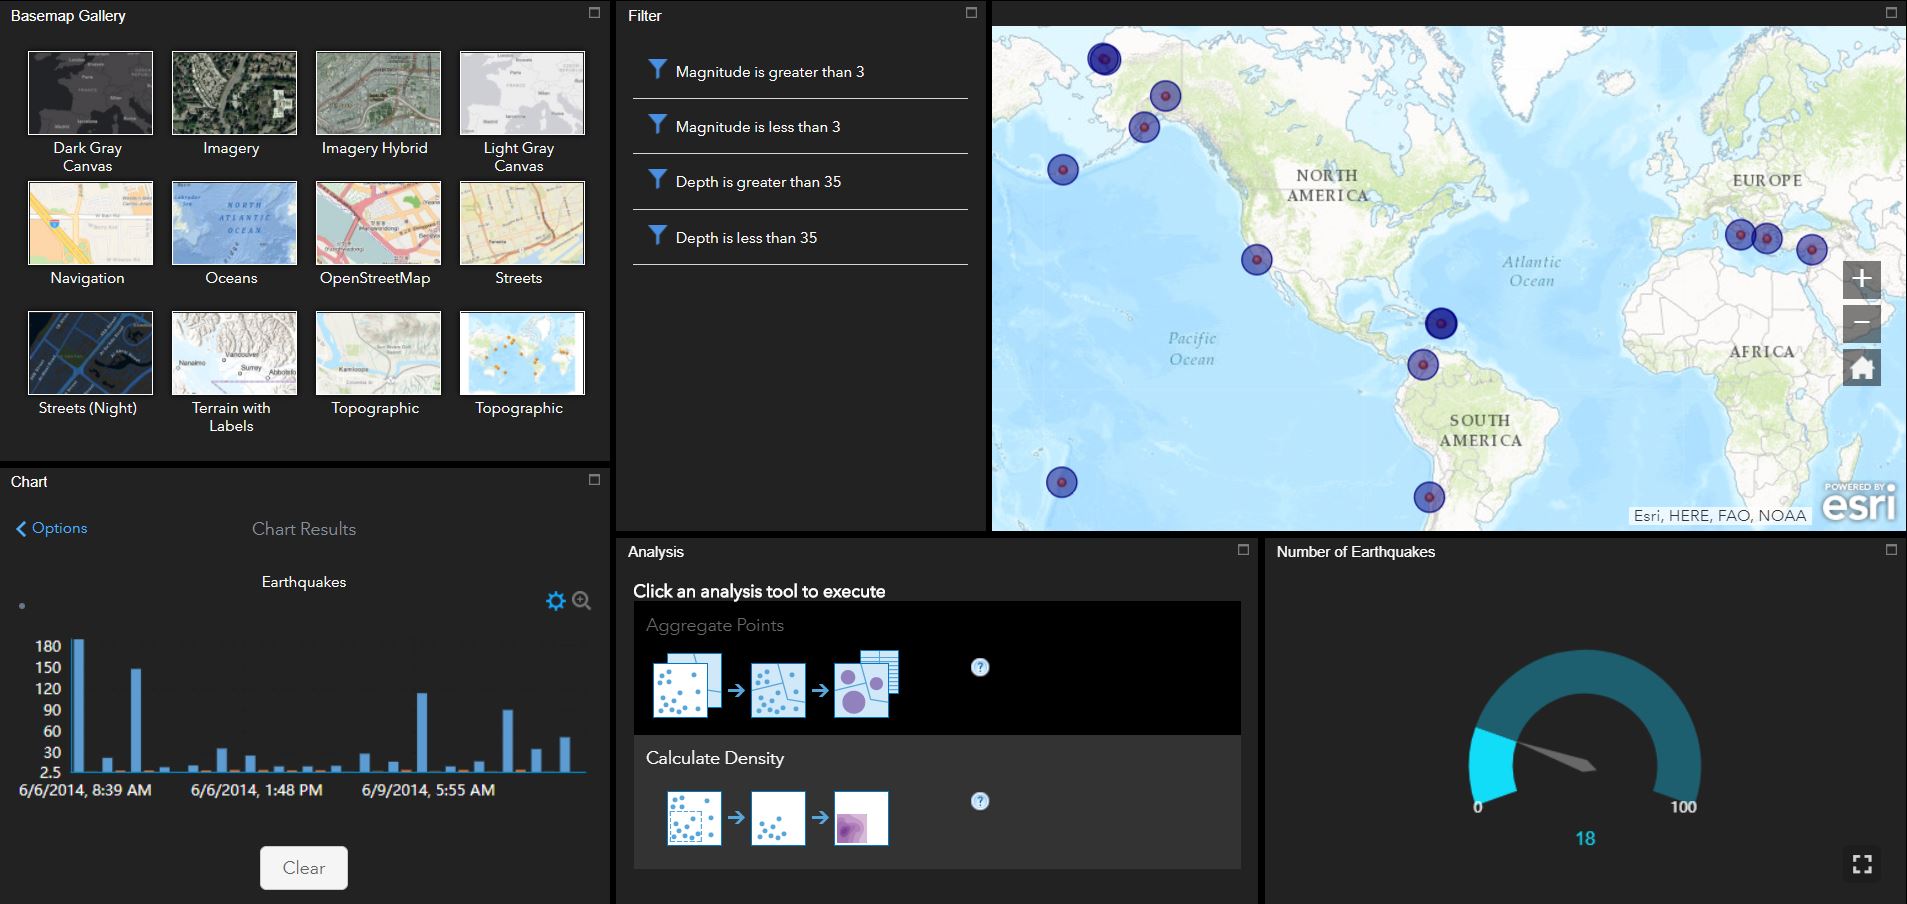
As well as the new Dashboard Theme there are five new widgets to choose from:
- Coordinate Conversion widget
- Infographics widget
- Parcel Drafter widget
- Screening widget
- Suitability Modeller widget
Rerun Analysis
Analysis results saved within the map can rerun it if necessary. A new button is available on the ribbon under the layer name. Parameters are remembered and can be updated before running again.
I have covered the main features of update in this blog and in the design blog released earlier in the month, however, if you want to see a full list of all the changes please see the What’s New page.
![]()