
Enrich tool - clarification of output
/If you’re getting unexpected results when using the Enrich tool, this blog will help you understand exactly how the tool functions behind the scenes, so that you can make sure your analysis is as accurate as possible.
The Enrich tool adds demographic and landscape information to your datasets from ArcGIS Online or locally installed Business Analyst data. When performing enrichment on point or line data, the tool must first create an associated polygon around the input data. The demographic data from within this polygon will then be aggregated to your original feature. One method of doing this involves the tool creating a buffer around the features based on a straight-line distance that you input.

The Enrich tool in both ArcGIS Online (left) and ArcGIS Pro (right). Defining the enrichment area as a straight line distance will create buffers around your input points.
By default, the tool creates the buffer using the geodesic method, as opposed to the planar method (also known as Euclidean). Geodesic buffers are those that account for the actual shape of the earth in 3 dimensions. Planar buffers, on the other hand, are calculated as points on a flat surface. Due to differences in coordinate systems, as well as the size and shape of the buffer, there can be significant differences in outputs between the two methods.
For example, here are 3 km planar and geodesic buffers around the same point in central Aylesbury using the WGS 1984 Web Mercator coordinate system, which is the default coordinate system in ArcGIS Online.
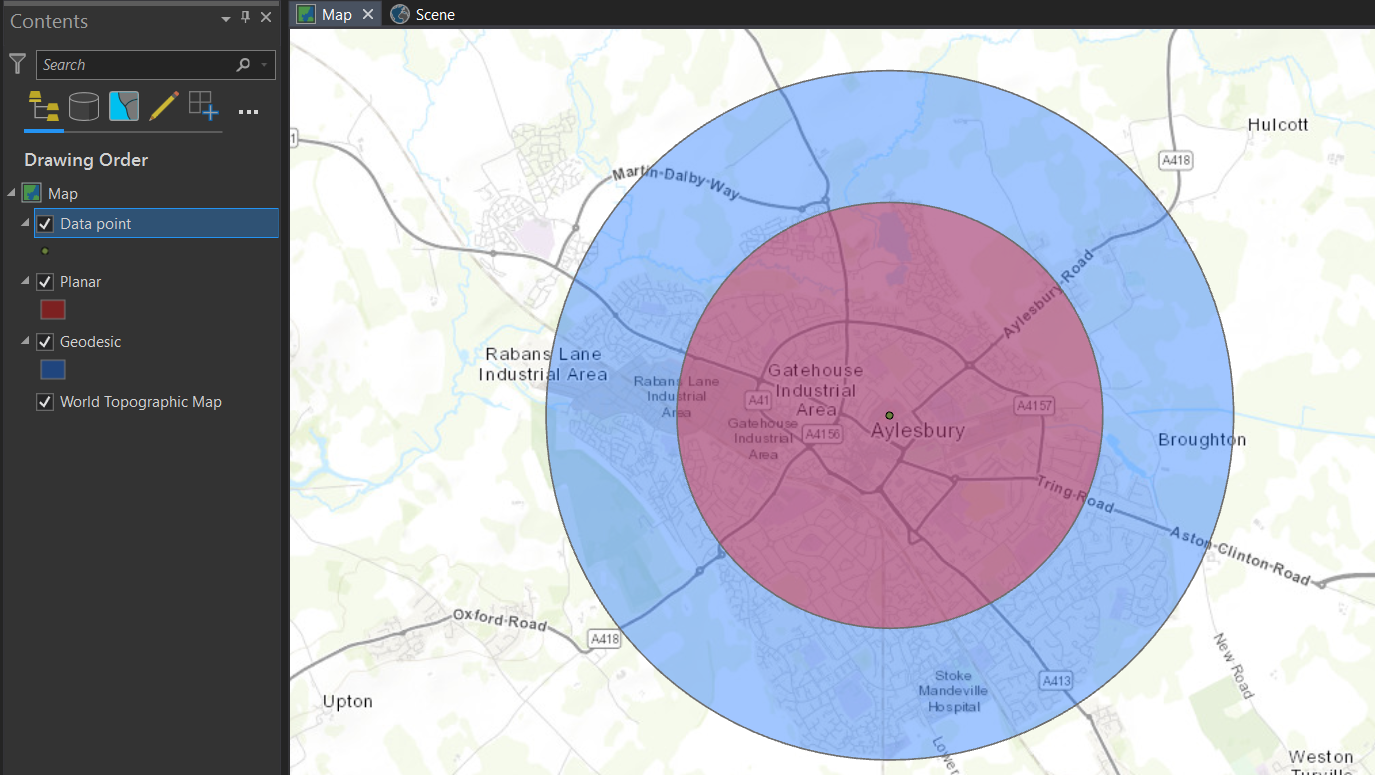
The planar buffer is shown in red, and the geodesic in blue.
If you have previously created buffers or measurements using the Euclidean method, the result in the output of your enrichment tool made using the geodesic method may therefore surprise you.
The reason for the difference shown here is due to the distortion associated with the Web Mercator projection. In a projected coordinate system, such as Web Mercator, there are sections of the projection where distances, areas, and the shape of features are distorted. For the Web Mercator projection, distortion is minimal near the equator but significant near the poles.

This graphic shows the difference in 1000 km buffers made using the Euclidean and Geodesic methods across the globe in the Web Mercator projection. The points near to the equator have geodesic and Euclidean buffers that are almost identical in size. This is because the Mercator projection does a good job of producing accurate distance measurements at the equator. However, the buffers of points far from the equator show considerably more distance distortion, with the Euclidean buffers being much smaller than the geodesic buffers. This occurs with the Mercator projection because at the poles areas are stretched (land masses close to the poles, such as Greenland and Antarctica, appear much larger in area compared with the land masses close to the equator). All 1,000 km Euclidean buffers are the same size since the Euclidean buffer routine assumes that map distances are the same everywhere in the projection, which is not true for the Mercator projection.
As a result of this, the geodesic method should provide a more accurate result when creating a buffer using a global projected coordinate system such as Web Mercator. More information about when to use each type of buffer, as well as further information about how buffer analysis works, can be found at this help page.