Our world is full of data. But this endless stream of numbers is of little value without a way to understand it. When it comes to extracting information from data, we need the freedom to work unencumbered by the tools we use.
We need to iterate through our ideas, explore the data we have and discover the answers we seek – all without worrying about getting things wrong.
This is what Insights is. It’s a new paradigm that can change our perception of how we work with spatial data.

1. An intuitive user experience
Insights is fluid and easy to use. Much of the user interaction is based around dragging and dropping and GIS-specific terminology is simplified wherever possible. Because of this, the learning curve is much shallower than a traditional GIS tool making it accessible to more people.
It also runs in a browser, once again, increasing its accessibility.
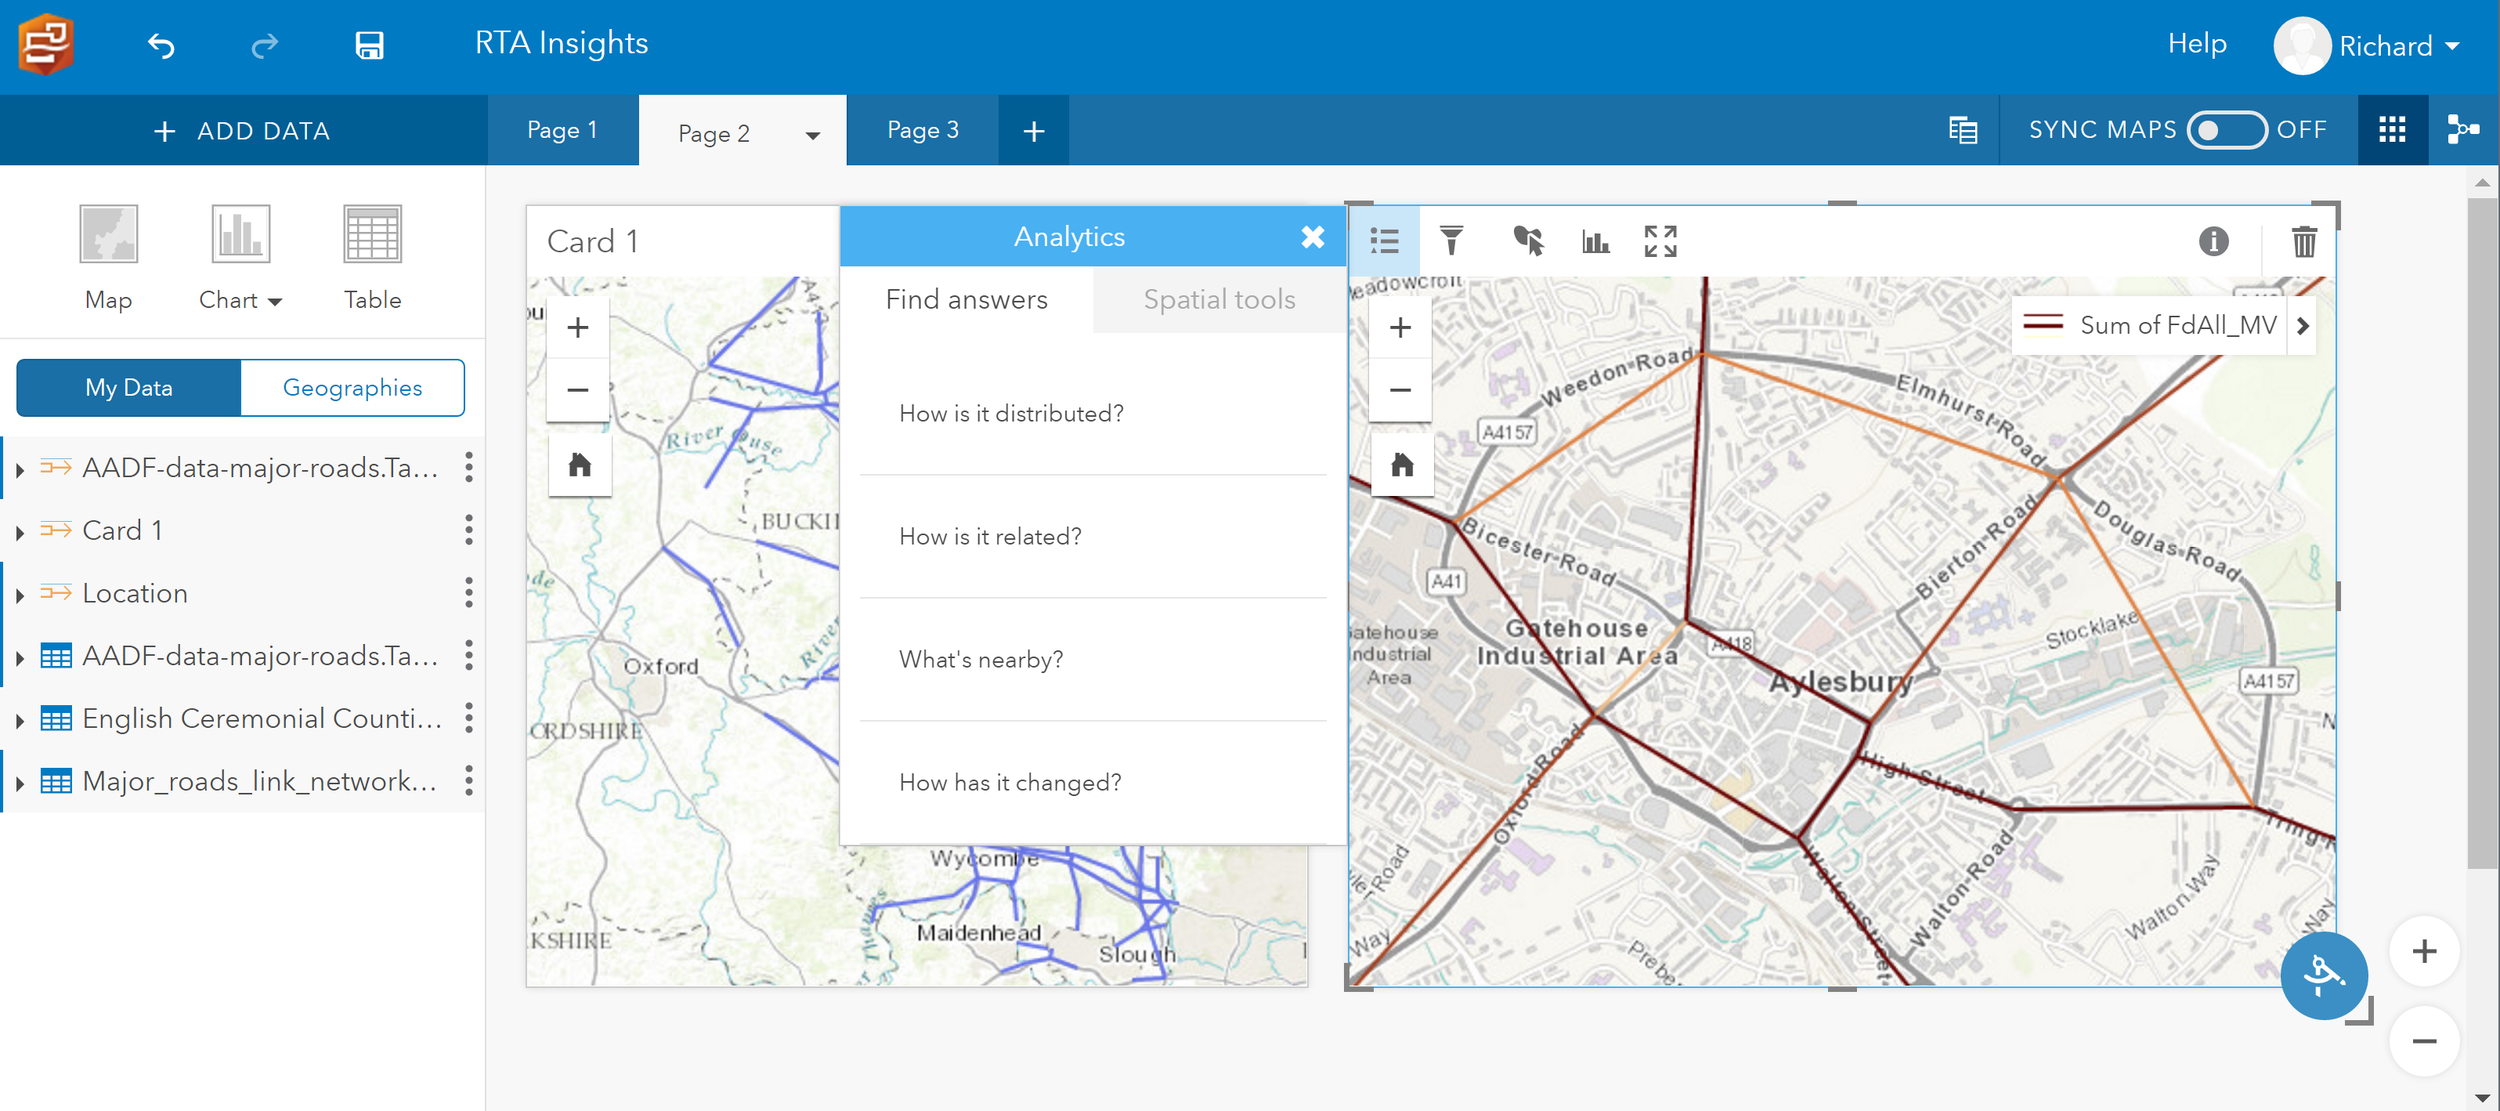
Analysis tools are framed as logical questions
2. Made a mistake? No problem!
We learn from pushing the boundaries and just giving things a go. Insights encourages this exploratory behaviour by making sure that if you take a wrong turn, you can always go back.
It does this in three main ways. Firstly, whenever you are about to affect a dataset, Insights will seamlessly replicate it. This means you automatically work on a copy and leave the original data untouched.
Secondly, Insights has a robust and responsive undo and redo toolset that let you step back and forward incrementally through your project.
Thirdly, your workings are always available in the “Analysis View”, so you don’t need to worry about remembering what steps you have taken. Insights also makes it easy for you to re-purpose and share these analysis workflows throughout your organisation.
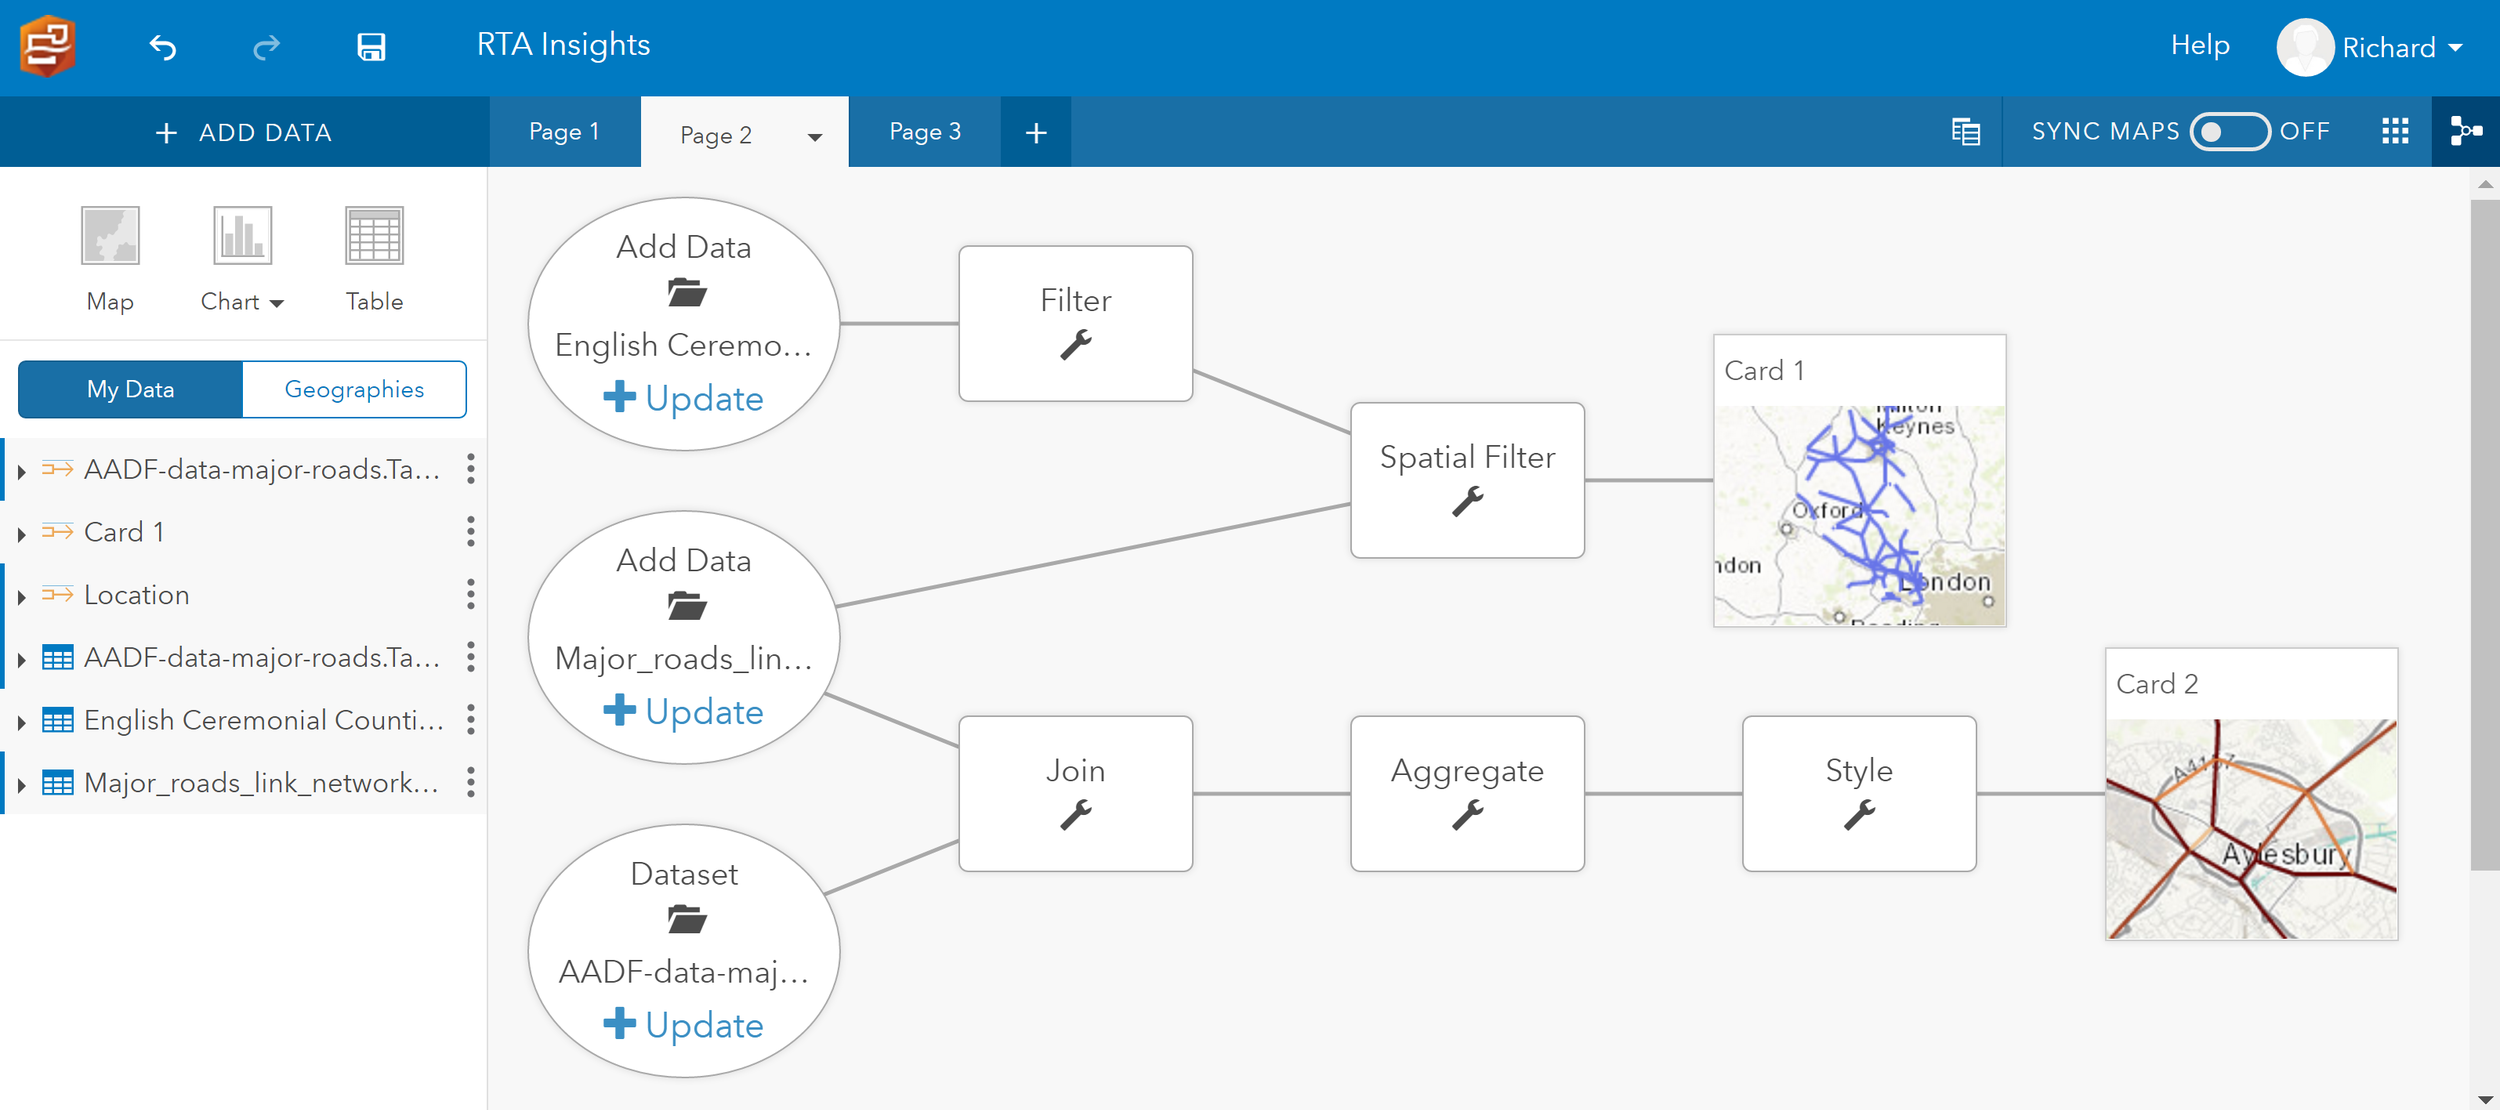
The analysis view lets you see how you got to the answers you found
3. More than maps
One of the things that impresses me the most is Insight’s charting capabilities. Tabular data and Feature Services can be turned into well-formatted graphs and charts in the blink of an eye. What’s more, the charts are interactive and work in unison with maps containing the same datasets.
We all love maps, but sometimes, a chart is a better way to visualise our data.
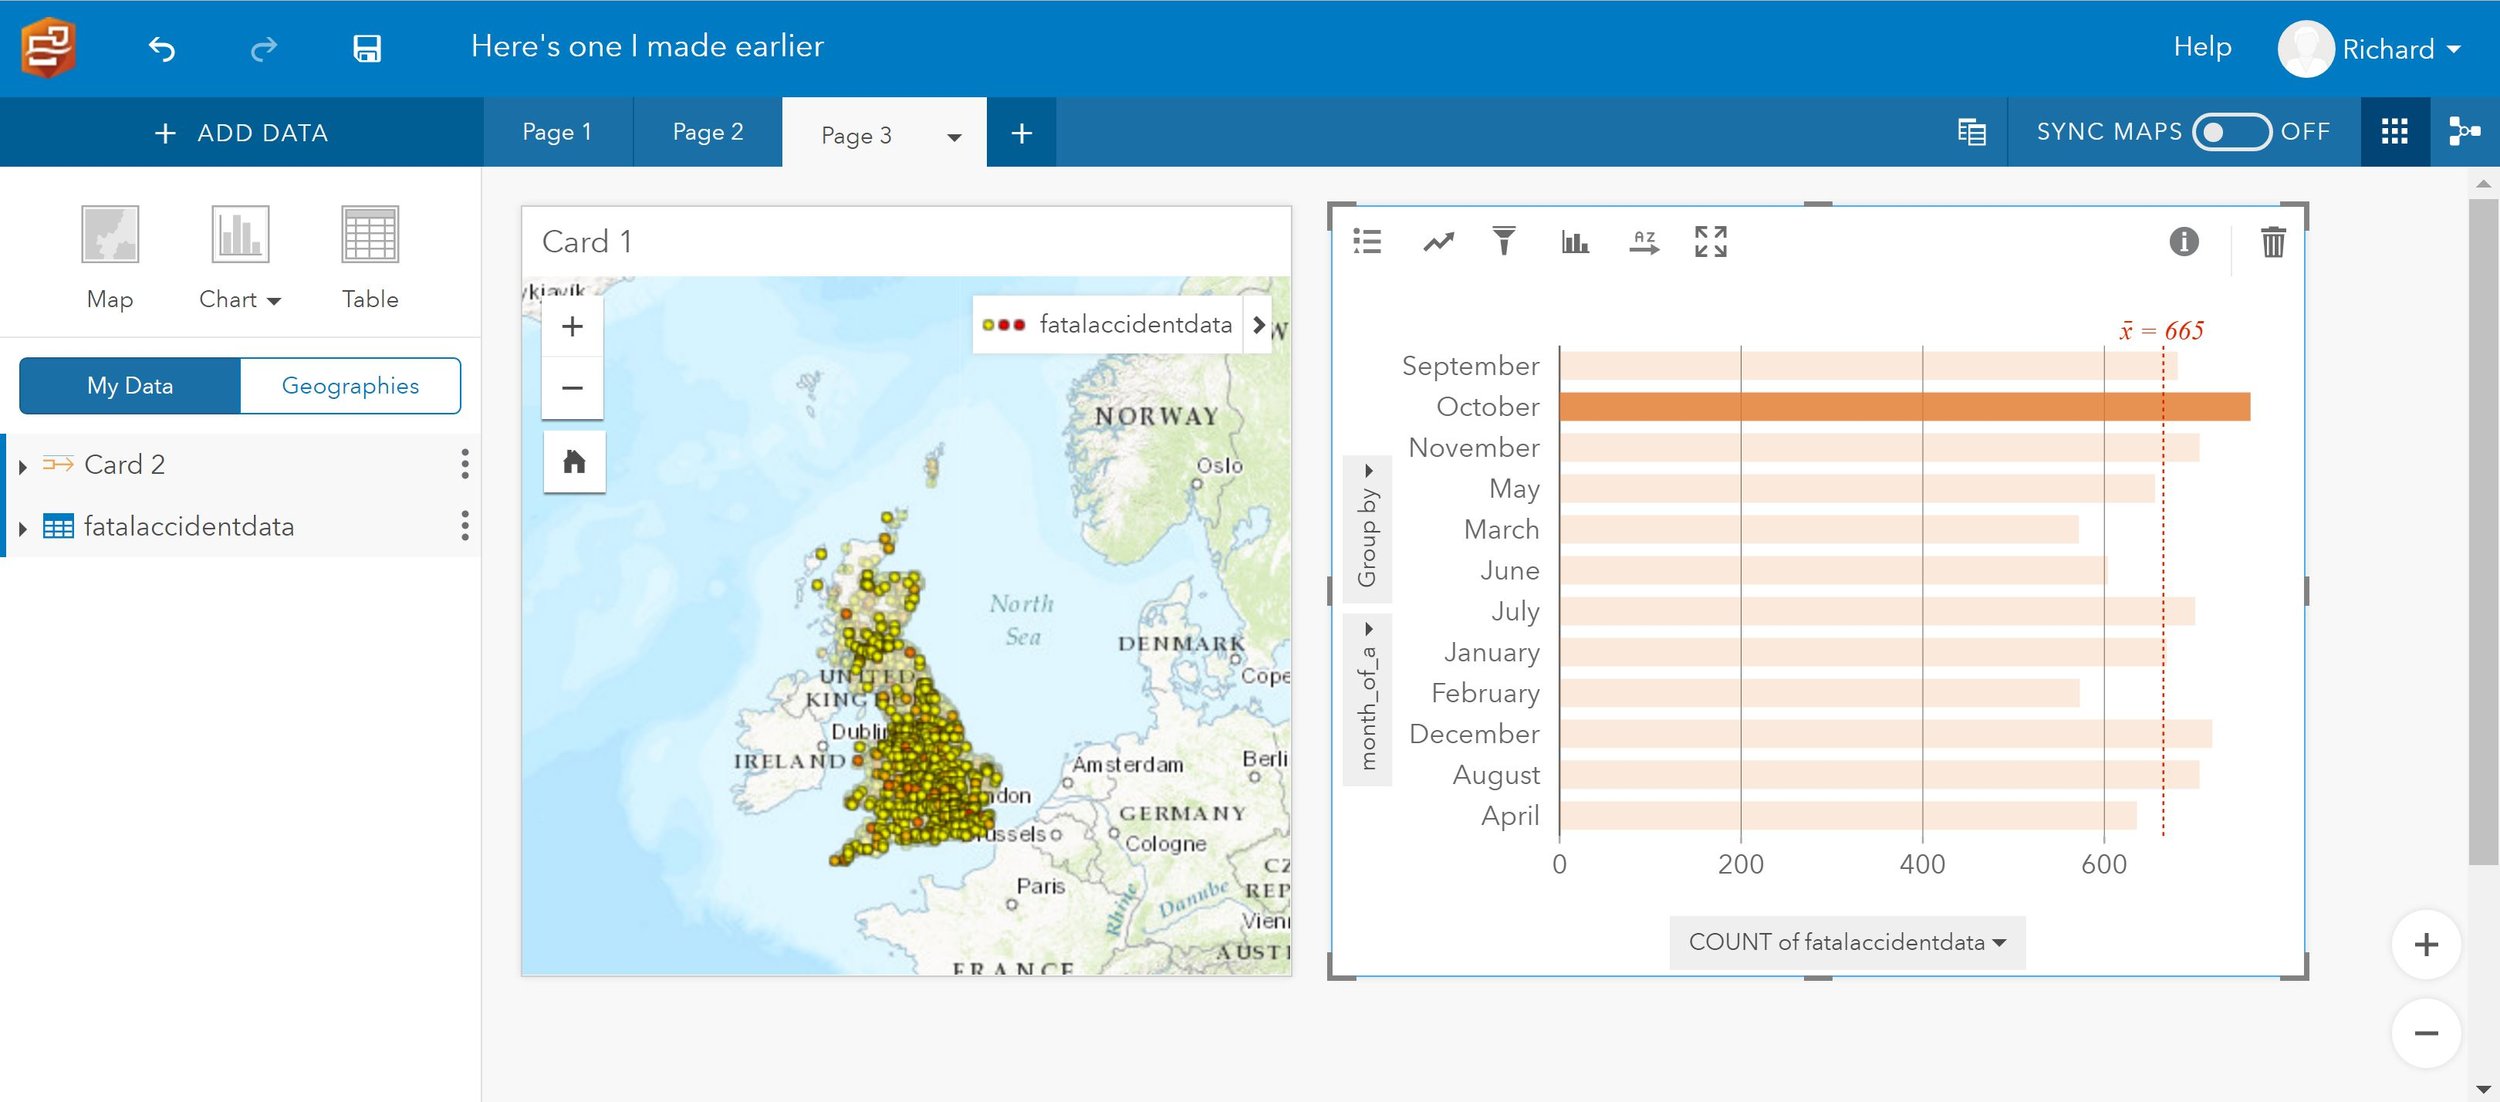
Charts and graphs give us a new way to look at our data
These are just three of the many great features available in this exciting addition to the ArcGIS Platform. Insights for ArcGIS is a premium app available as an addition to ArcGIS Enterprise 10.5.
I would encourage you to find out more on the product page and also watch this great video demo.