When you’re at the coast and gaze off into the horizon, do you know which countries are directly across the sea from you? I recently tried to answer this question by creating a map that went on to be featured on The Telegraph, Mail Online, BBC News and, more recently, Esri’s Maps We Love gallery.

My inspiration for ‘Coastal views from the United Kingdom’ came from exploring Andy Woodruff’s beautiful Beyond the sea maps. I challenged myself to see if I could create something similar for the UK, using only ArcGIS. This blog post documents my workflow.
Analysis
My first step was to calculate a series of viewpoints along the UK’s coastline. I could have plotted viewpoints at equal intervals (i.e. every 10 meters), however I was only really interested in locations where there is a significant change in the direction of the coastline.
Using the Esri World Countries dataset, it was possible to extract the coastline for the United Kingdom.

Coastline derived from the Esri World Countries dataset
Coastlines are complex and in a GIS can have millions of vertices. To optimise processing time and produce a more visually pleasing result, I generalised the coastline using a point remove method.

Generalised coastline
Once generalised, I calculated the midpoint (or centroid) for each segment of the UK coastline, using the Feature to Point tool. As such, viewpoints were effectively plotted for each generalised length of coastline.
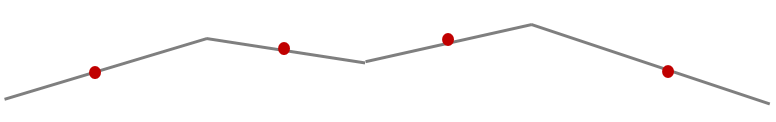
Viewpoints – midpoint of each line segment
Calculating every possible line of sight would have taken too long to process, therefore at each viewpoint, I assumed that a person would be facing perpendicular to the coastline. I plotted a small, perpendicular line across each segment’s centroid and then clipped the portion that intersected with the land, to preserve only those facing out to sea.
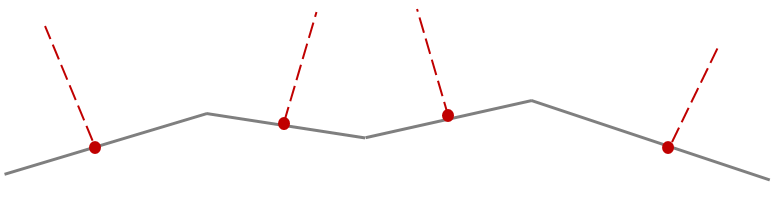
Perpendicular ‘view lines’ from each viewpoint
I then calculated the seaward bearing of the remaining lines. I used these values as inputs in the Bearing Distance to Line tool to generate geodesic view lines for each coastal segment. I then clipped these to the first intersection with the Esri World Countries dataset. Geodesic lines are the shortest distance between two points on the surface of the globe. On a flat 2-dimensional map, these lines appear curved.
Final assembly
I wanted to present the final features on top of a dark and desaturated basemap. Taking inspiration from John Nelson, I created a custom basemap using data derived from NASA Visible Earth Blue Marble. If you would like to use my moody basemap in your own maps, you can access it from here.
The final step was to pull all the elements together in a custom web app using the ArcGIS API for JavaScript (v3.17). Creating a custom app allowed me to animate the data using CSS SVG animations. I have shared the source code in a GitHub repo – feel free to play around with it and animate your own lines!
Results
The final map reveals the 37 countries that you can see from the UK coastline, or theoretically see if you didn’t have to contend with long distances and the curvature of the earth.
You might be surprised to find what you’re looking at from some locations e.g.
o Stiffkey, Norfolk > Russia (8,810 miles away)
o Shetland, Scotland > Dominican Republic (4,886 miles)
o Pembroke, South Wales > Antarctica (7,898 miles)
o Barmouth, North Wales > Brazil (4,447 miles)
o Bude, Cornwall > Bahamas (4,642 miles)
o Bideford, North Devon > Puerto Rico (4,327 miles)
o Chesil Beach, Dorset > you can see past France and Spain all the way to Brazil (4,233 miles )
If you would like to know more or share your own ideas, connect with me!
Ben