With the new capability in Business Analyst Online allowing you to import you own data, it’s time to get excited about the possibilities for us, here in the UK. You can now use your data, along with Michael Bauer Research (MBR) data and the Living Atlas, to really understand your area of interest and make the most informed decisions. Let’s have a look at what you can do…
Data
Bringing in your own data is a great addition to Business Analyst Online and couldn’t be easier to do. Add the data from your content or groups, configure a custom data setup, or import a file from your computer (this includes shapefiles and spreadsheets). Then, overlay content from the Living Atlas or enrich your data using MBR data – conveniently built into Business Analyst to use to your heart’s content.
Mapping
There are three main ways to map in Business Analyst Online:
- Colour-Coded Maps
- Smart Map Search
- Suitability Analysis
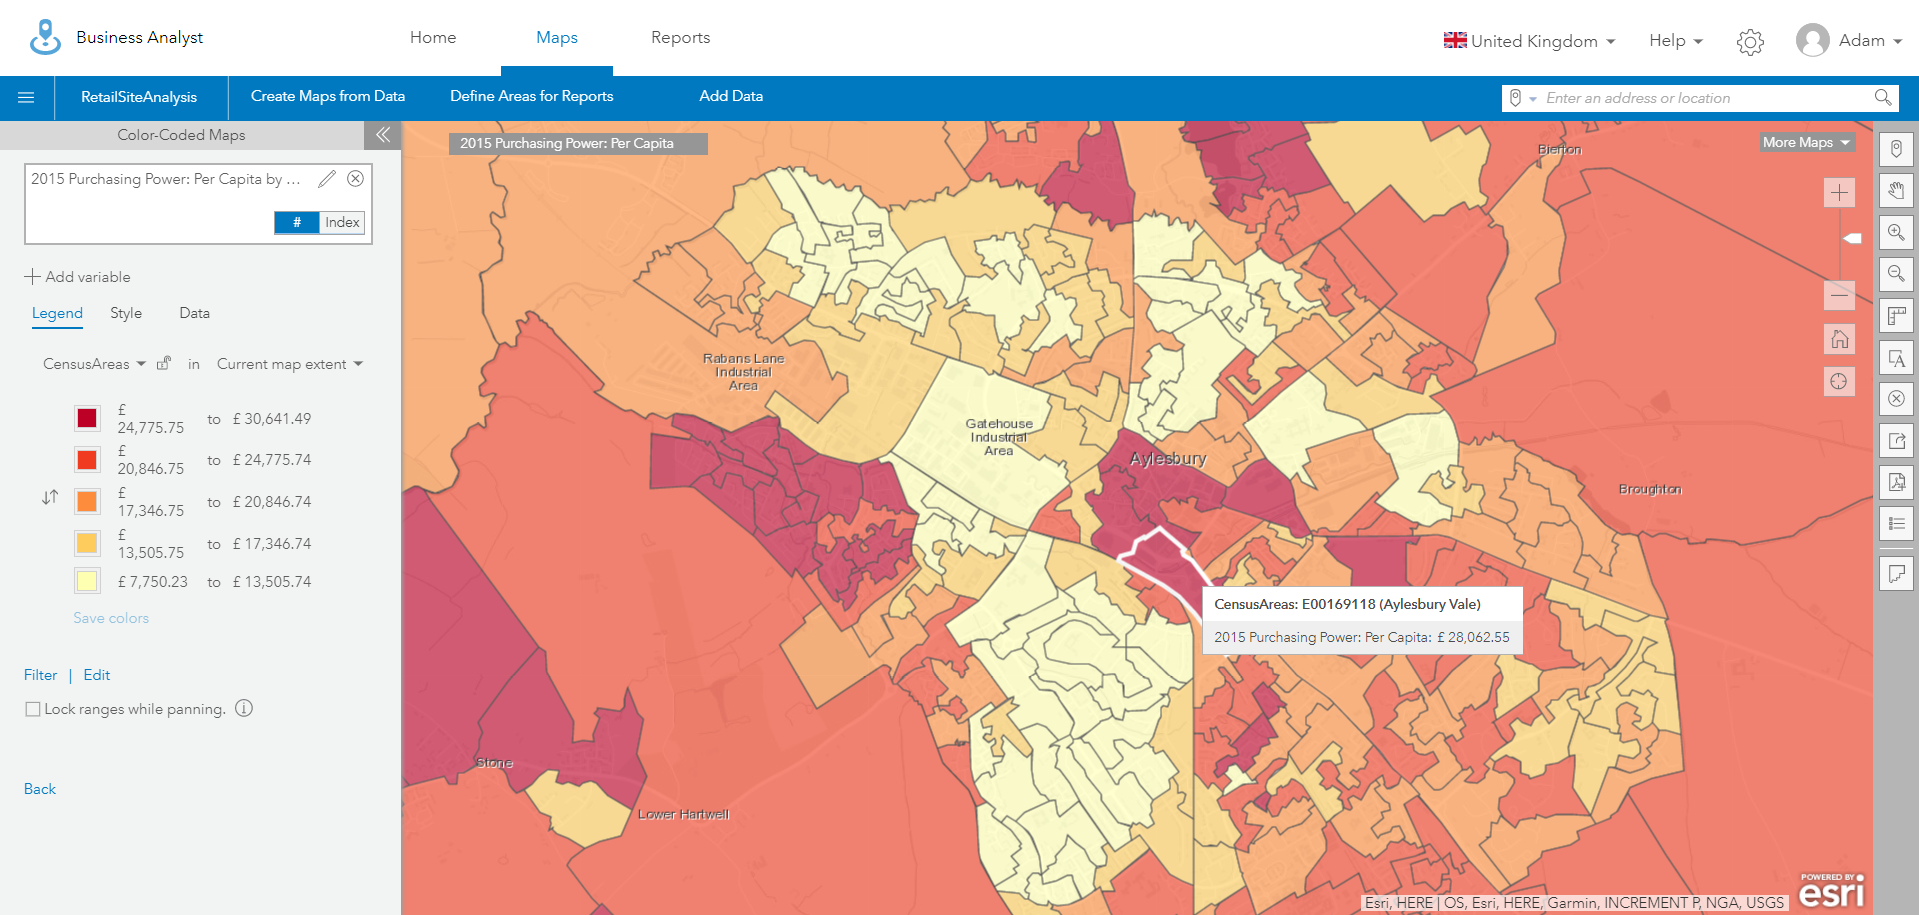
Colour-coded maps are what we are all used to. Simply select a variable and map it – use the MBR data to get the most powerful insights into an area. Here, I’ve got purchasing power per capita for Aylesbury.
Smart-mapping takes this once stage further and allows you to combine up to five different variables from various data sources. You can then view just the areas that meet your criteria. I’m using my own data on the population and number of workers within 2km of that grid square and purchasing power from MBR. By changing the ranges, the map will dynamically update to the areas that meet that criteria. The images below show where there is a high population, with lots of workers, earning a high income. Pretty useful stuff, if you ask me.
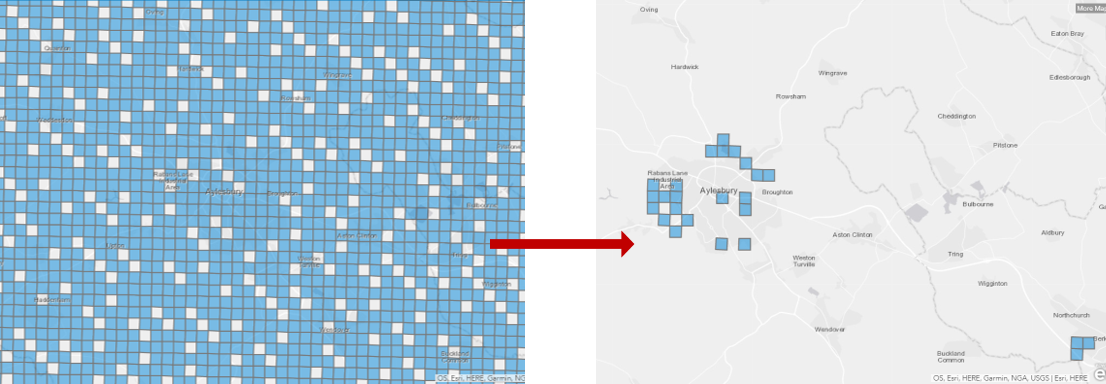
You may have noticed another useful feature of smart mapping. Even though my boundaries were custom grid squares and the MBR data isn’t, you can still combine them – the MBR data aggregates to the boundaries I’ve used.
If you want to understand the suitability of a location, perhaps a new store for example, you can use the Suitability Analysis tool. This could be existing or potential stores to find out who is over or under performing, or where should perform well based on your criteria. At this point, I should mention that Business Analyst Online is not just for retailers. Check out the example below, showing the suitability of three schools based on; the number of 15-17 year-olds in education, the number of students with no qualifications and average household size.
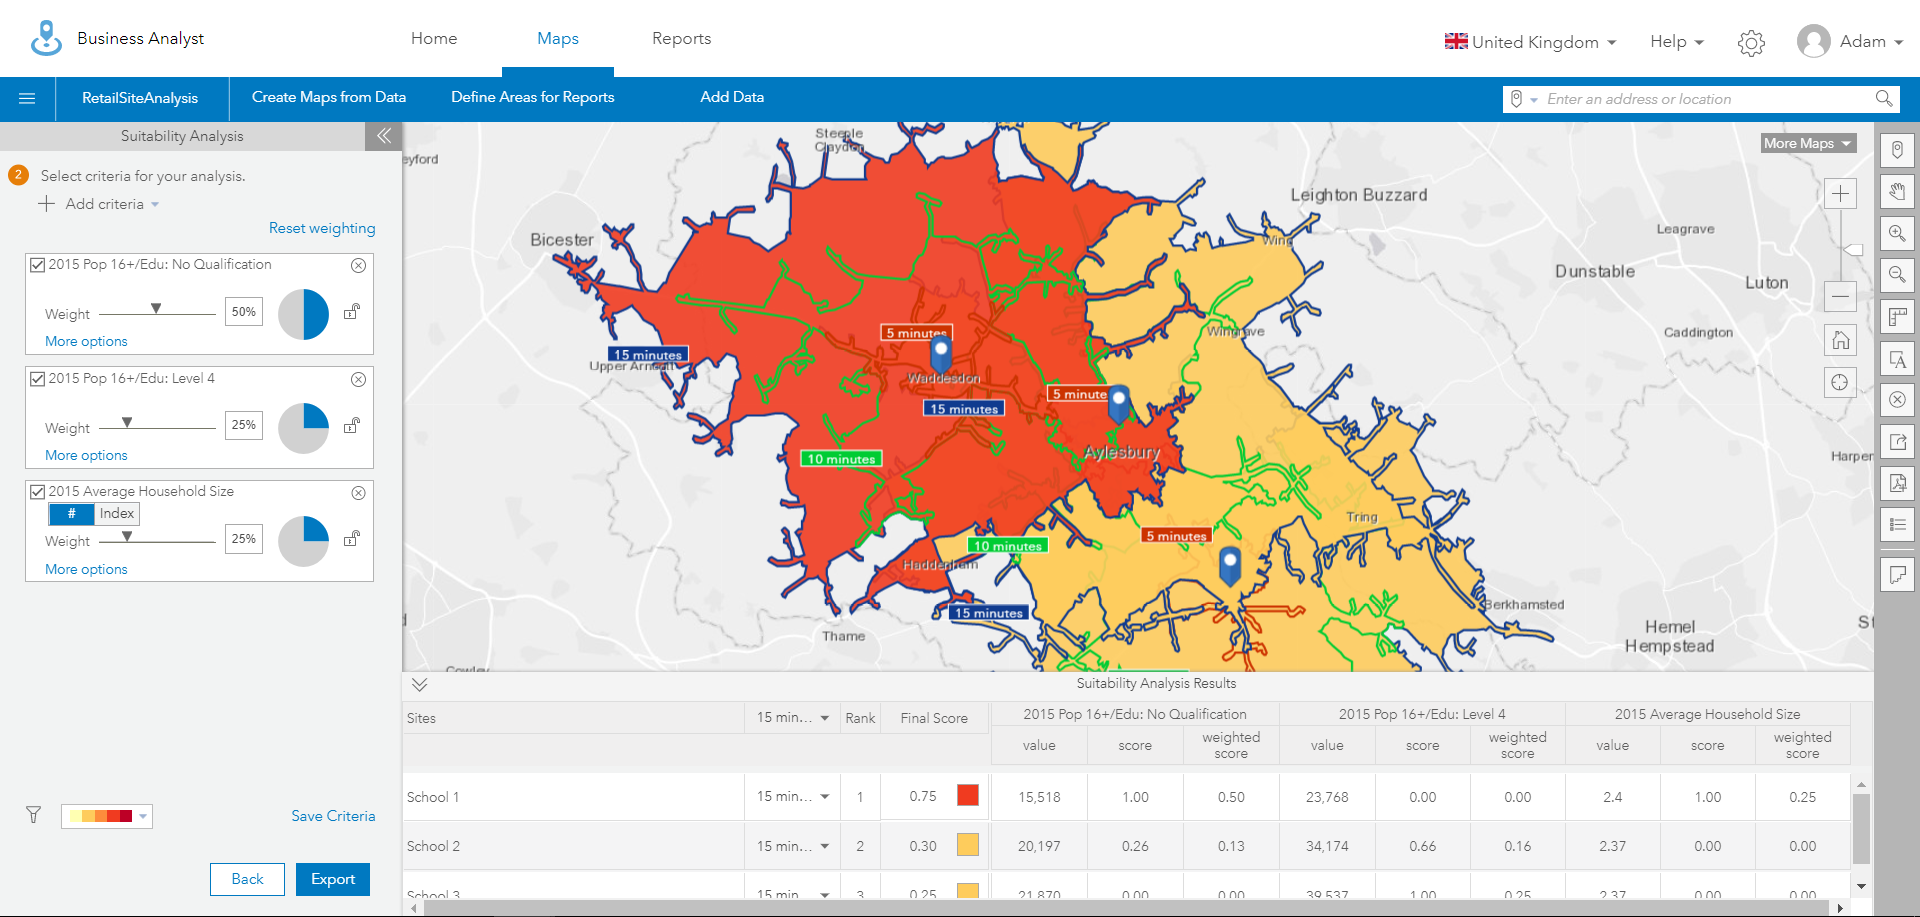
Set buffers (rings, drive or walk time) to understand how distance may impact the suitability of a site or change the weightings of your chosen variables depending on what you are most interested in. I decided that the number of students with no qualifications is twice as important in my analysis as the other two variables. When you are happy with your weightings you can even export the results to excel.
Reports and Infographics
So far, we’ve run some analysis and mapped it, but what if you need to share it with others in a simple yet engaging way? The answer – reports and infographics.
Here’s a summary report I made for a potential new store in Aylesbury. You can include your own logo, colours and fonts – and add charts, images or maps too.
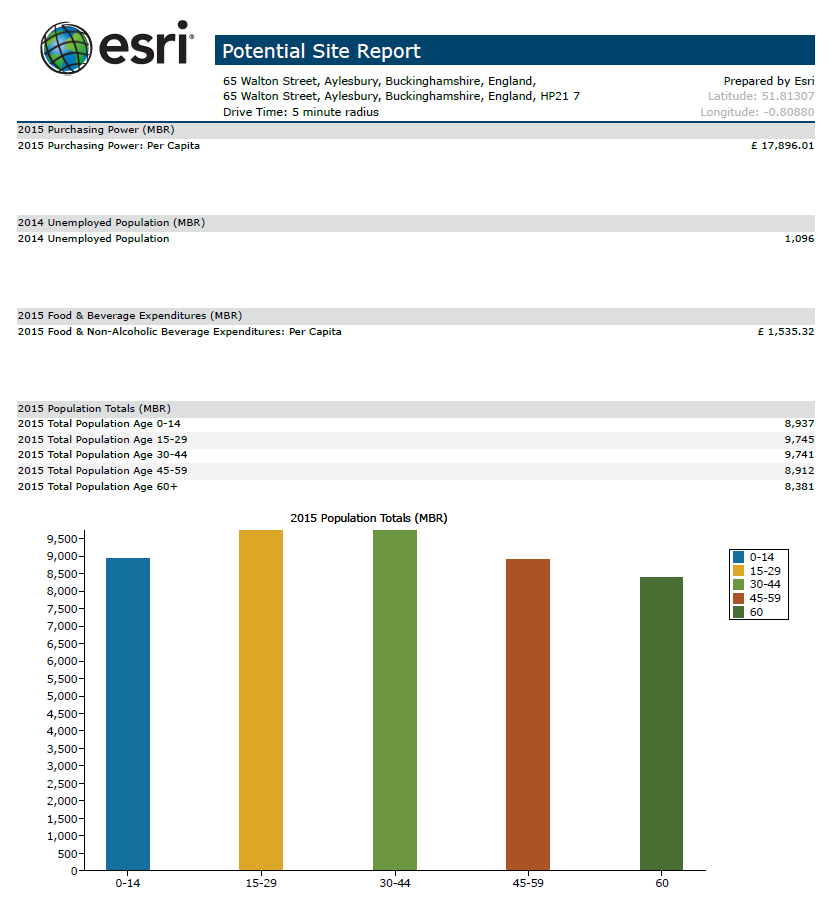
This one is looking at a 5-minute drive time radius, but identical reports have been run for 10 and 15 minutes also. The resulting report (or infographic) will include information for each buffer that you set up.
Infographics allow you to visualise similar information to that you would put into a report, but in a more engaging way. You can interact with the infographic content, pan and zoom (if you included a map) and switch the buffers. This means you can convey your point easily and effectively, without the need for pages and pages of text or numbers. Once you’ve got the view you need, export the infographic – as an image, pdf, or dynamic html.
You have the option to create your own custom reports and infographics or use a template. You can also create custom templates, from your reports, and share across your organisation so others can use them. There is then no confusion as to what the structure of a report should look like.
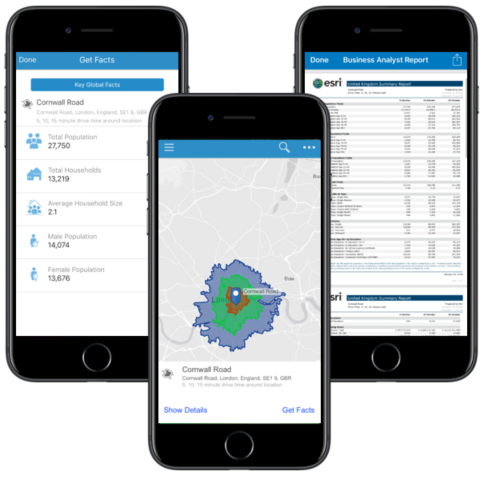
Mobile
Finally, included in your license for Business Analyst Online is the use of the mobile app. So you can also: get a quick snapshot for a location, capture new information, compare sites, or even scope out the competition. All on your phone:
I hope this has given you a little food for thought on how you can make the most of Business Analyst Online using your own data. To see some of this in action I’ve done an accompanying video. If you need any other information head over to the documentation here.
![]()